With Bitcoin’s price up over 50% in 2023, crypto winter may be thawing, but business is still tough nonetheless for exchanges.
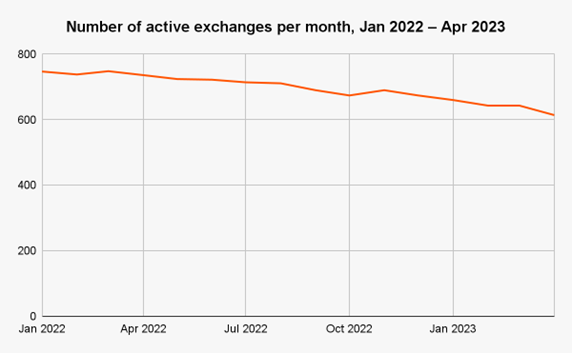
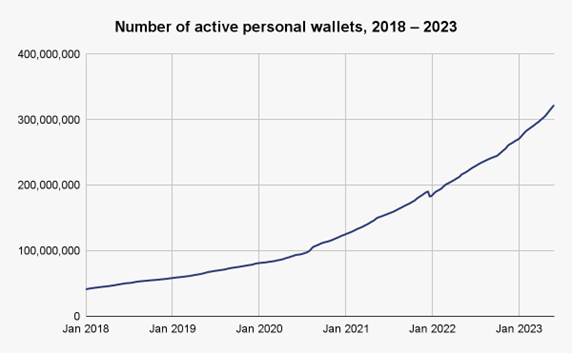
Since the start of 2022, the number of active centralized cryptocurrency exchanges has fallen from 750 to 640, due to pressure from decreasing transaction volumes amidst harsh market conditions, and ever-increasing competition from decentralized exchanges (DEXes). However, at the same time, the number of cryptocurrency users is still increasing. We approximate that growth on the graph below, which shows the number of active or balance-holding personal wallets — also known as unhosted wallets, as they are not hosted by a service and are under the sole control of the owner — across all blockchains Chainalysis supports over the last five years.
Exchanges that can win over the crypto users behind those wallets and take market share now will be in the best position to reap the rewards when crypto winter ends and transaction volumes pick up again. But not all users are the same. Exchanges need to segment their users, and focus on onboarding and retaining the ones that will drive the best outcomes for their business.
Crypto Exchanges: Transparency
Luckily, cryptocurrency’s inherent transparency allows exchanges to segment more effectively than in any other industry. Only in cryptocurrency can you see the holdings, transaction habits, and product preferences of your users and prospects in real time. Armed with that data, exchanges can make data-driven decisions about where to focus their user acquisition and retention efforts. How exactly can they do it? In this guide, we’ll lay out a sample model for exchange user segmentation based on on-chain data, and show you how those segments translate into insights that can drive ROI in exchanges’ user acquisition and retention strategies.
Read: Crypto industry under fire: Coinbase sued for unregistered securities exchange
Segmenting crypto users by wallet age and holdings
On-chain data-based user segmentation can take many forms, as there are several characteristics a business can use to compare crypto wallets. However, for the purposes of this exercise, we’ll focus on two simple ones: overall holdings and wallet age. By separating wallets along those two axes, we came up with six separate segments, though of course, an exchange could look at more segments if they separated wallets more granularly.
- Early retail: Wallets active since before January 1, 2020 with holdings below $10,000 USD.
- Early professional: Wallets active since before January 1, 2020 with holdings between $10,000 and $10 million.
- Early institutional: Wallets active since before January 1, 2020 with holdings above $10 million.
- Late retail: Wallets that became active on or after January 1, 2020 with holdings below $10,000.
- Late professional: Wallets that became active on or after January 1, 2020 with holdings between $10,000 and $10 million.
- Late institutional: Wallets that became active on or after January 1, 2020 with holdings above $10 million.
Here’s what those segments look like across the Bitcoin and Ethereum blockchains.
| Value held by cohort | Number of personal wallets | Average held per wallet | Average active weekly wallets | |
| Early retail | $20,629,987,000 | 46,146,000 | $450 | 250,000 |
| Early professional | $124,348,074,000 | 1,740,000 | $71,470 | 142,000 |
| Early institutional | $108,472,036,000 | 9,000 | $11,632,390 | 2,000 |
| Late retail | $15,454,498,000 | 71,347,000 | $220 | 10,440,000 |
| Late professional | $129,011,882,000 | 2,931,000 | $44,010 | 1,745,000 |
| Late institutional | $176,802,249,000 | 10,000 | $17,567,790 | 4,000 |
The vast majority of active wallets in a given week are those in late retail, meaning relatively new, low-balance wallets. Interestingly, there are also far more active wallets in the late professional segment than the early retail segment, which underscores just how many people have come to cryptocurrency in recent years and made significant investments, while many earlier entrants have either dropped out, shifted their activity to new wallets, or embraced a passive long-term holding strategy. Overall, late retail wallets represent the majority of all wallets by a wide margin, but command the least capital.
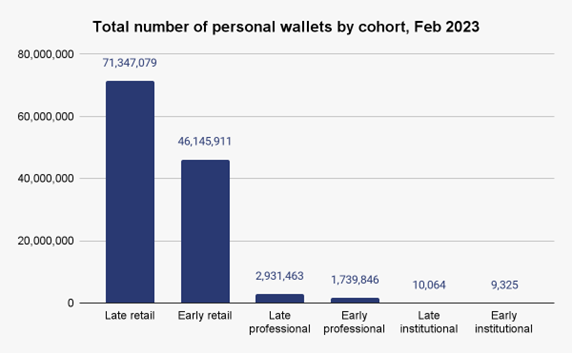
Overall, the relative newcomer groups of late institutional and late whale wallets account for the majority of Bitcoin and Ether currently held by personal wallets. But the more important question for this exercise is, how do these segments interact with exchanges? Centralized crypto exchanges generally make money from trading fees. While we don’t have the insight into exchange order books necessary to calculate fees generated by each segment — all we have is on-chain data — let’s assume that the total funds transferred on-chain to crypto exchanges from each segment roughly tracks with trading fees generated from each segment. Crypto is typically sent from personal wallets to exchanges to be traded rather than held, so this seems like a reasonable assumption.
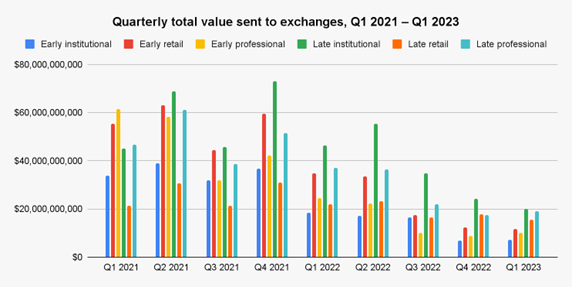
Since the start of 2021, late institutional wallets account for the biggest share of value sent to centralized exchanges by personal wallets at 23.6%. However, both late professional and early retail wallets are close behind at 18.8% and 19.0% respectively. Overall, in most quarters there’s relative parity among segments in value sent to exchanges, with the exception of late retail wallets and early institutional wallets, which account for 11.4% and 11.9% respectively of total value sent to exchanges during this time period. Both segments exhibit this lag for different reasons — late retail wallets because they command the least capital compared to other segments, and early institutional wallets because they make up the lowest share of all active wallets.
Testing segment analysis on a real crypto exchanges: FTX case study
Our wallet-based user segments differ in how they interact with exchanges, but what do those differences mean for exchanges? And how can the people running exchanges translate segment behavior into a successful acquisition and retention strategy? We’ll explore this below using on-chain data from a real, widely used exchange: FTX. While FTX of course collapsed in November 2022, before that it was one of the most popular exchanges in the industry, with a huge, active user base. The on-chain footprint of those users in the months before FTX’s demise give us a large, real-world dataset to analyze through the lens of our user segmentation framework.
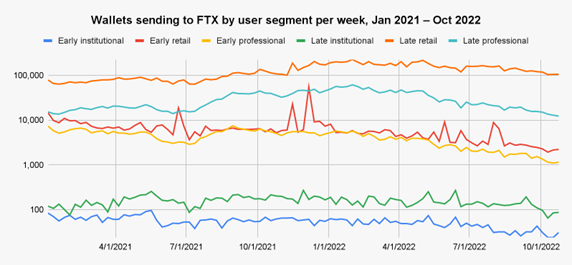
Interestingly, FTX’s user base doesn’t quite match the overall landscape of personal wallets. Yes, late retail wallets make up the vast majority of the user base, but late professionals are in second nearly every week, despite being the third-most common wallet segment overall, well behind the second-most common segment of early retail. Unsurprisingly, the two small but ultra-wealthy segments of late institutional and early institutional make up the smallest share of FTX’s user base — but as we’ll see below, that isn’t true if we evaluate the segments in terms of inflows.
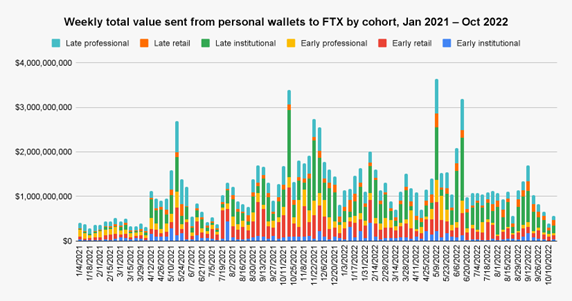
Late institutional wallets dominate inflows to FTX, accounting for 30.0% of the total during the time period studied despite making up just 0.1% of the user base in an average week. Late professionals are second, and account for 21.4% of value sent to FTX — that’s more in line with the 17.6% of FTX’s total user base they make up. Late retail wallets made up a small share of inflows at just 7.6% despite making up 75.8% of the user base in the average week. It’s important to note that each segment’s share of inflows fluctuates significantly throughout the time period. While late institutional wallets lead in most weeks, this was not the case at the very beginning of the time period — from January 2021 through mid-April 2021, late institutional wallets were often the lowest-ranked segment for inflows, and it wasn’t until fall of 2021 that they took firm hold as the top user segment. That pattern is likely due to the fact that many more institutional investors entered cryptocurrency over the course of 2021 as prices were trending upward, but it could also suggest an effort by FTX’s team to court these high-value users.
It can be difficult to compare the segments as a whole since they vary so much in number of users — both within FTX’s user base and across the entire crypto ecosystem — and in the amount of cryptocurrency available to them. Furthermore, segmenting is just the first step toward assessing individual users and prospective users, and thinking about how best to attract and retain them. In order to continue that process, let’s get a bit more granular and look at the inflows FTX got from the average wallet in each segment, keeping in mind that we’re assuming here that inflows translate linearly to exchange revenue.
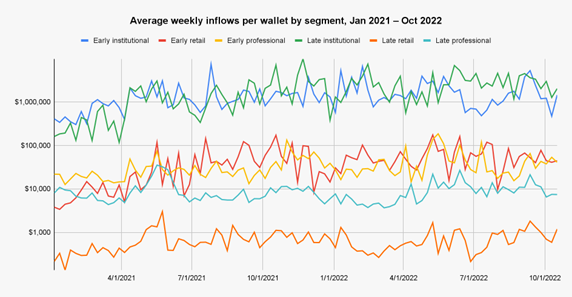
Four rough tiers emerge when we look at the average wallet in each segment and the weekly inflows they send to FTX. We break these down below, and show the average weekly inflows FTX could expect from a single wallet in each segment:
| Tier | Segment | Average weekly inflows per wallet |
| Tier 1 | Late institutional | $2,131,134 |
| Early institutional | $1,591,522 | |
| Tier 2 | Early retail | $48,124 |
| Early professional | $37,462 | |
| Tier 3 | Late professional | $9,231 |
| Tier 4 | Late retail | $701 |
Unsurprisingly, wallets in the two institutional segments are the most valuable, as they have significant holdings and there aren’t very many of them. Tier 2 is more surprising, where we see that early retail wallets are a bit more valuable than early professional wallets, with average weekly inflows of $48,000 to $35,000, and much more valuable than late professional wallets, which are in tier 3 and have average weekly inflows of just under $10,000. How could this be possible, especially considering that early retail wallets hold a balance of $10,000 or less? First, keep in mind that our segmentation is based on wallets’ balances at the very beginning of the time period studied — in this case January 2021 — and that wallets don’t switch segments even as they gain more funds. It’s possible that early retail wallets were more likely to be more strategic crypto investors than others given they likely have more experience in the space, and that therefore more early retail wallets saw their balances grow in 2021 and 2022. It’s also possible that early retail wallets were more likely to have access to funds held in other wallets or services, which could also account for balance growth over the course of the time period studied. Regardless, the unexpectedly high value of the early retail segment shows that exchanges must pay close attention to how the behavior of their users’ personal wallets changes over time, and adjust their strategy accordingly.
Late retail wallets accounted for the lowest volume of weekly inflows at an average of $701 per wallet.
Another factor exchanges need to keep in mind when assessing user value is churn or the rate at which users abandon their platform. A user who sends $50,000 per week to the exchange may sound better than one who sends $20,000, but if the first user churns after just two weeks, the second may be more valuable in the long run. Below, we look at the average weekly churn rate for each segment — churn rate here means the percent of users in one week who aren’t active on FTX in the next week.
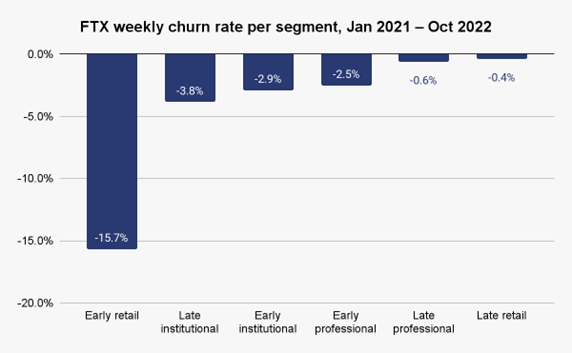
The first takeaway is that early retail wallets churn at a much higher rate than any other: 15.7% per week compared to 3.8% for the all-important late institutional segment, which has the second-highest churn rate. Late professionals and late retail wallets, on the other hand, churn at by far the lowest rates — 0.6% and 0.4% respectively. Interestingly, late wallet users tend to be much more loyal to FTX than early wallet users across all balance levels. Perhaps FTX onboarded many new users into crypto, who then didn’t want to leave and go through the hassle of learning a new platform, while more experienced users were more comfortable jumping around.
As we mentioned above, churn rate is nearly as important to assessing a user’s value to the exchange as their inflows. And, by combining the two, we can calculate the exchange’s expected total inflows over the user’s entire lifetime with the exchange for each cohort. The formula is:
Let’s look at each segment’s lifetime expected inflows on the table below:
| Segment | Average weekly inflows per wallet | Weekly churn rate | Lifetime expected inflows |
| Early retail | $48,124 | 15.7% | $306,522 |
| Early professional | $37,462 | 2.5% | $1,498,480 |
| Early institutional | $1,591,522 | 2.9% | $54,880,069 |
| Late retail | $701 | 0.4% | $175,250 |
| Late professional | $9,231 | 0.6% | $1,538,500 |
| Late institutional | $2,131,134 | 3.8% | $56,082,474 |
Factoring in churn rate significantly alters how an exchange may value users in different segments compared to if they only looked at average inflows. For instance, while early retail wallets initially appear to be slightly more valuable to FTX than early professional wallets, we see that early professionals on average send nearly 5x more crypto to FTX over their entire lifetime due to their significantly lower churn rate. In fact, early retail wallets end up being less than twice as valuable as late retail wallets, despite sending more than 60x more to the exchange per week — early retail wallets simply churn at such a high rate that most of the difference in inflows cancels out. Similarly, we see that early institutional wallets are slightly more valuable than late institutional wallets despite sending less to the exchange per week. Late professionals and early professionals end up being extremely close in lifetime value, even though weekly inflows from late professionals are about a third of those from early professionals on average. Keep in mind of course that this data reflects only FTX’s user base, and that the trends may look very different for other services.
These insights can be hugely valuable to an exchange’s user acquisition and retention strategies, as well as product development. For instance, imagine a scenario in which FTX wants to acquire new users by airdropping rewards to personal wallets that are active on other exchanges. By sorting target wallets into these segments, FTX could be precise in offering different rewards to each wallet based on their segment’s expected lifetime inflows. Similarly, if FTX wanted to increase retention among its rank-and-file users, it may conclude that it should focus heavily on the early retail segment, as even a small improvement in its extremely high churn rate would result in outsized returns given their high average weekly inflows. Regardless of the specific circumstances, the ability to put a value on each wallet would help FTX market to its users and prospective users more effectively than they could otherwise.
On-chain data changes the game for web3 marketing
The inherent transparency of blockchains is one of the biggest differentiators for cryptocurrency compared to other asset classes and sectors of the tech industry. We hope we’ve shown here how industry participants can use that transparency to grow their business. By segmenting users with on-chain data, exchanges can allocate their strategy, marketing, and product development resources with the best possible efficiency and maximize the value of each user. When combined with exchanges’ proprietary data, such as order book activity and other relevant user information, these insights become even more powerful. As the cryptocurrency industry continues to grow and more web2 companies join web3, we look forward to seeing how businesses can tap into on-chain data in new ways to reach users more effectively.
For more tech news, click here.