Wealth inequality is a major concern for the world economies, with many countries witnessing a massive gap when it comes to the wealth inequality index.
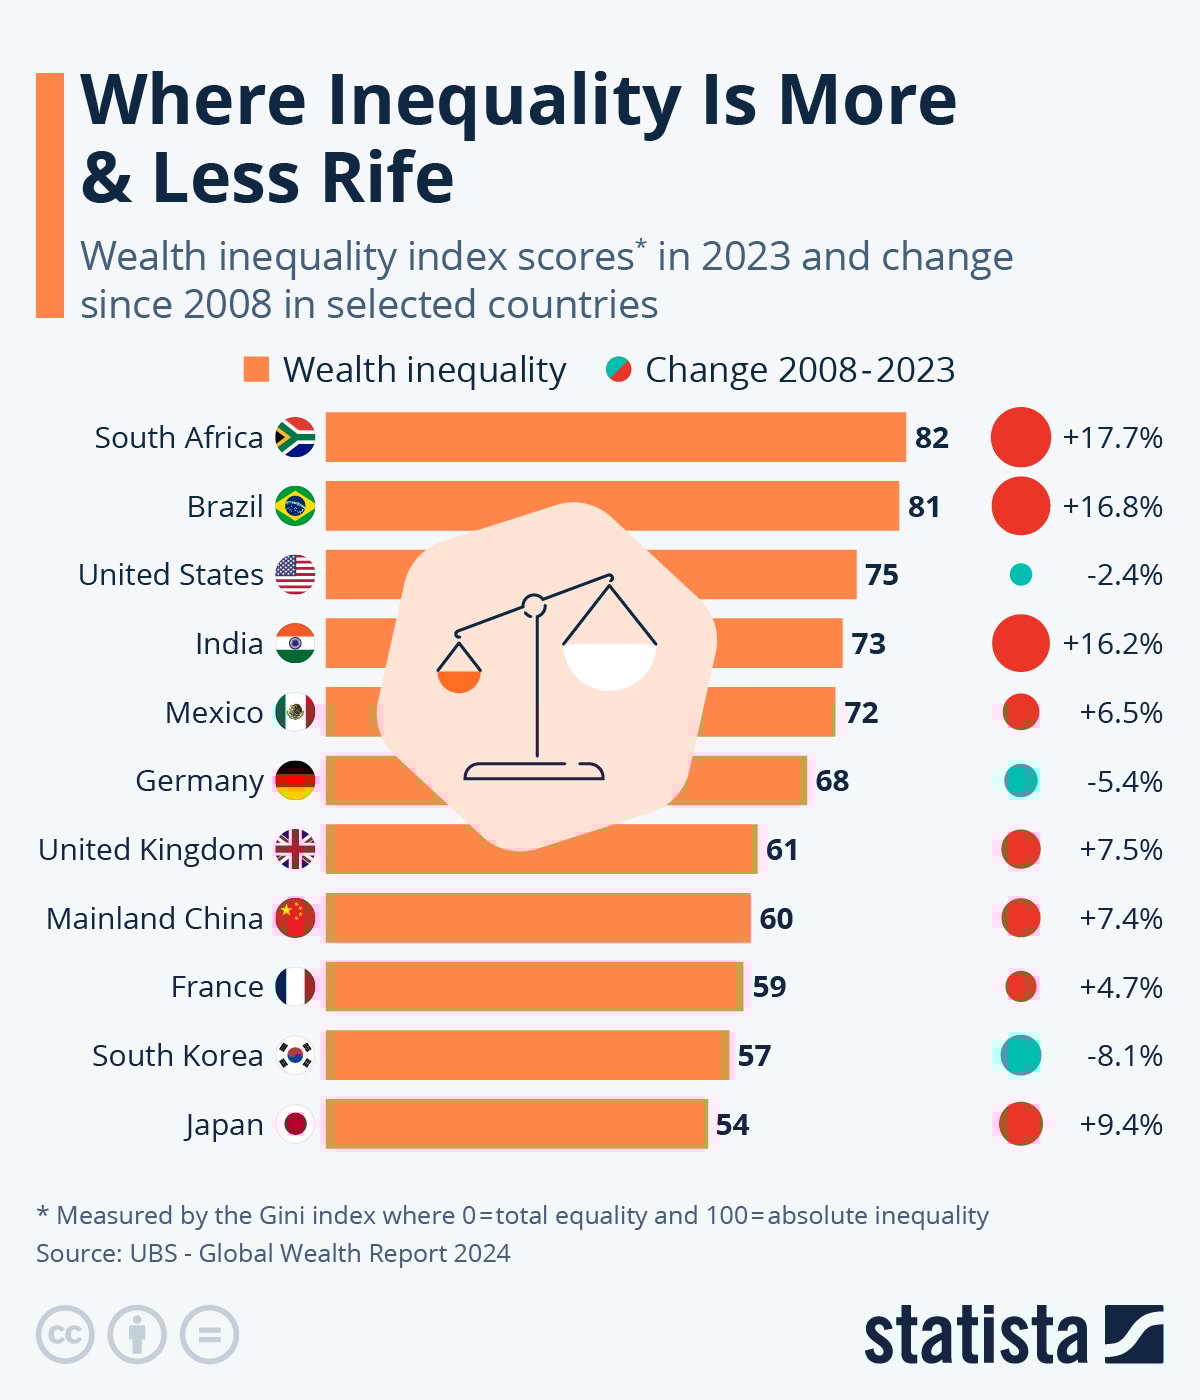
South Africa tops the list, scoring 82 out of 100 on the inequality index, where 0 indicates total equality and 100 indicates absolute inequality, according to a report published by UBS. This is a jump of 17.7 percent since 2008. Other countries with particularly high scores were Brazil (81), Sweden (75), United States (75) and Mexico (72). Meanwhile, Belgium scored 46, compared to 51 in 2008, a change of minus 10.7 percent, thus sitting at the opposite end of the table.
Key highlights
The gap on inequality has closed slightly in North America since 2008, with the U.S. recording a decrease of 2.4 percent in that time frame. Inequality has widened in Latin America and much of Eastern Europe and Asia though. As you can see in the below chart, Brazil saw a wealth increase in inequality of 16.8 percent and Mexico a rise of 6.5 percent, as India saw an increase of 16.2 percent, Singapore of 22.9 percent, Indonesia of 15.1 percent, China of 7.4 percent and Japan of 9.4 percent. South Korea and Hong Kong buck the regional trend, with decreases of 8.1 percent and 5.9 percent, respectively. According to the report, while inequality is increasing in fast-growing markets, the opposite is true in a number of mature economies, where middle wealth segments are outpacing the pace of growth of higher wealth brackets.
Inequality since 2008
Equality, or the lack of it, is a prominent topic of discussions about wealth. Since 2008, inequality in North America has slightly decreased, while it has gone up in Latin America as well as most of Eastern Europe and Asia, with the notable exceptions of South Korea and Hong Kong SAR. Inequality is measured with the help of the Gini coefficient, a number between zero and 100. A reading of zero means exact equality, i.e., a scenario where everybody owns exactly the same amount of wealth, while a reading of 100 means that one individual owns all of the assets and everybody else owns zero, i.e., absolute inequality.
Who hosts the most millionaires
The U.S. hosts the highest number of millionaires in the world, according to the report, at nearly 22 million people. Mainland China is in second place with just over six million, roughly double the number of the third market, the United Kingdom. No other market counts in excess of three million millionaires. Japan, Germany and France have a millionaire population just below that level, while Canada and Australia count fewer than two million people in this cohort.
In percentage terms, these numbers are equally revealing: the U.S. hosts 38 percent of the world’s millionaires, Western Europe 28 percent and Mainland China 10 percent, equivalent to the sum of Japan, India, Indonesia, South Korea, Singapore and Thailand. Interestingly, the relatively small Netherlands hosts over 1,200,000 dollar millionaires, approximately as many as Italy and Spain, nearly twice as many as Hong Kong SAR and almost four times as many as Singapore.
By 2028, the number of adults with wealth of over $1 million will have risen in 52 of the 56 markets, the report added. In at least one market – Taiwan – this increase may reach 50 percent. Two notable exceptions are expected to be the United Kingdom and the Netherlands.
World getting richer
Last year, global wealth rebounded from its 2022 slump. Wealth is steadily growing throughout the world – albeit at different speeds – with very few exceptions. The proportion of people in the world in the lowest wealth bracket has shrunk since 2008, while the proportion of people in every other wealth bracket has grown. The percentage of adults in that lowest wealth band, below $10,000, nearly halved between the year 2000 and 2023. Most of these people moved up into the considerably wider second band, situated between $10,000 and $100,000, which more than doubled. And people are now three times as likely to have wealth exceeding $1 million.
EMEA leading in wealth, lagging in growth
EMEA enjoys the highest wealth per adult in US dollar terms, at just over $166,000 on average, followed by APAC with slightly over $156,000 and the Americas with $146,000. When looking at the growth rate in wealth per adult, however, things turn upside down: EMEA is last with under 2.3 percent, while the Americas nearly reach 5.8 percent and APAC almost 6.6 percent. Since 2008, average wealth has increased by roughly 122 percent in APAC, 110 percent in the Americas and approximately 41 percent in EMEA. APAC comes second in wealth per adult, the Americas come last.
The high speed of growth in wealth in Asia-Pacific is not terribly surprising per se, since we would expect to see emerging economies catch up and converge with mature markets, however, these numbers serve to confirm that the convergence has been in full swing since 2008.
What does the future hold
The report suggests that in 2024 the emerging economies’ share of global wealth will break through the 30 percent mark, rising to nearly 32 percent by 2028, and that the percentage of adults in the lowest wealth bracket will decline further in the next five years.
In Japan and Korea, the report estimates that the number of millionaires will increase by over 25 percent, in Taiwan by almost 50 percent. It expects the organic growth in wealth to account for some of this stark increase in millionaires, mainly thanks to Taiwan’s microchip industry that is set to reap the rewards of the boom in artificial intelligence, a substantial chunk is due to come from immigration by wealthy foreigners.
The projected increase in wealth is expected to be visible in all wealth segments. The number of adults owning in excess of $50 million, which has already gone up substantially since 2008, is forecast to keep rising over the next four years.
For more miscellaneous news, click here.